GEX Pro
Professional Terminal
Institutional Grade Analytics
Market Structure
Decoded.
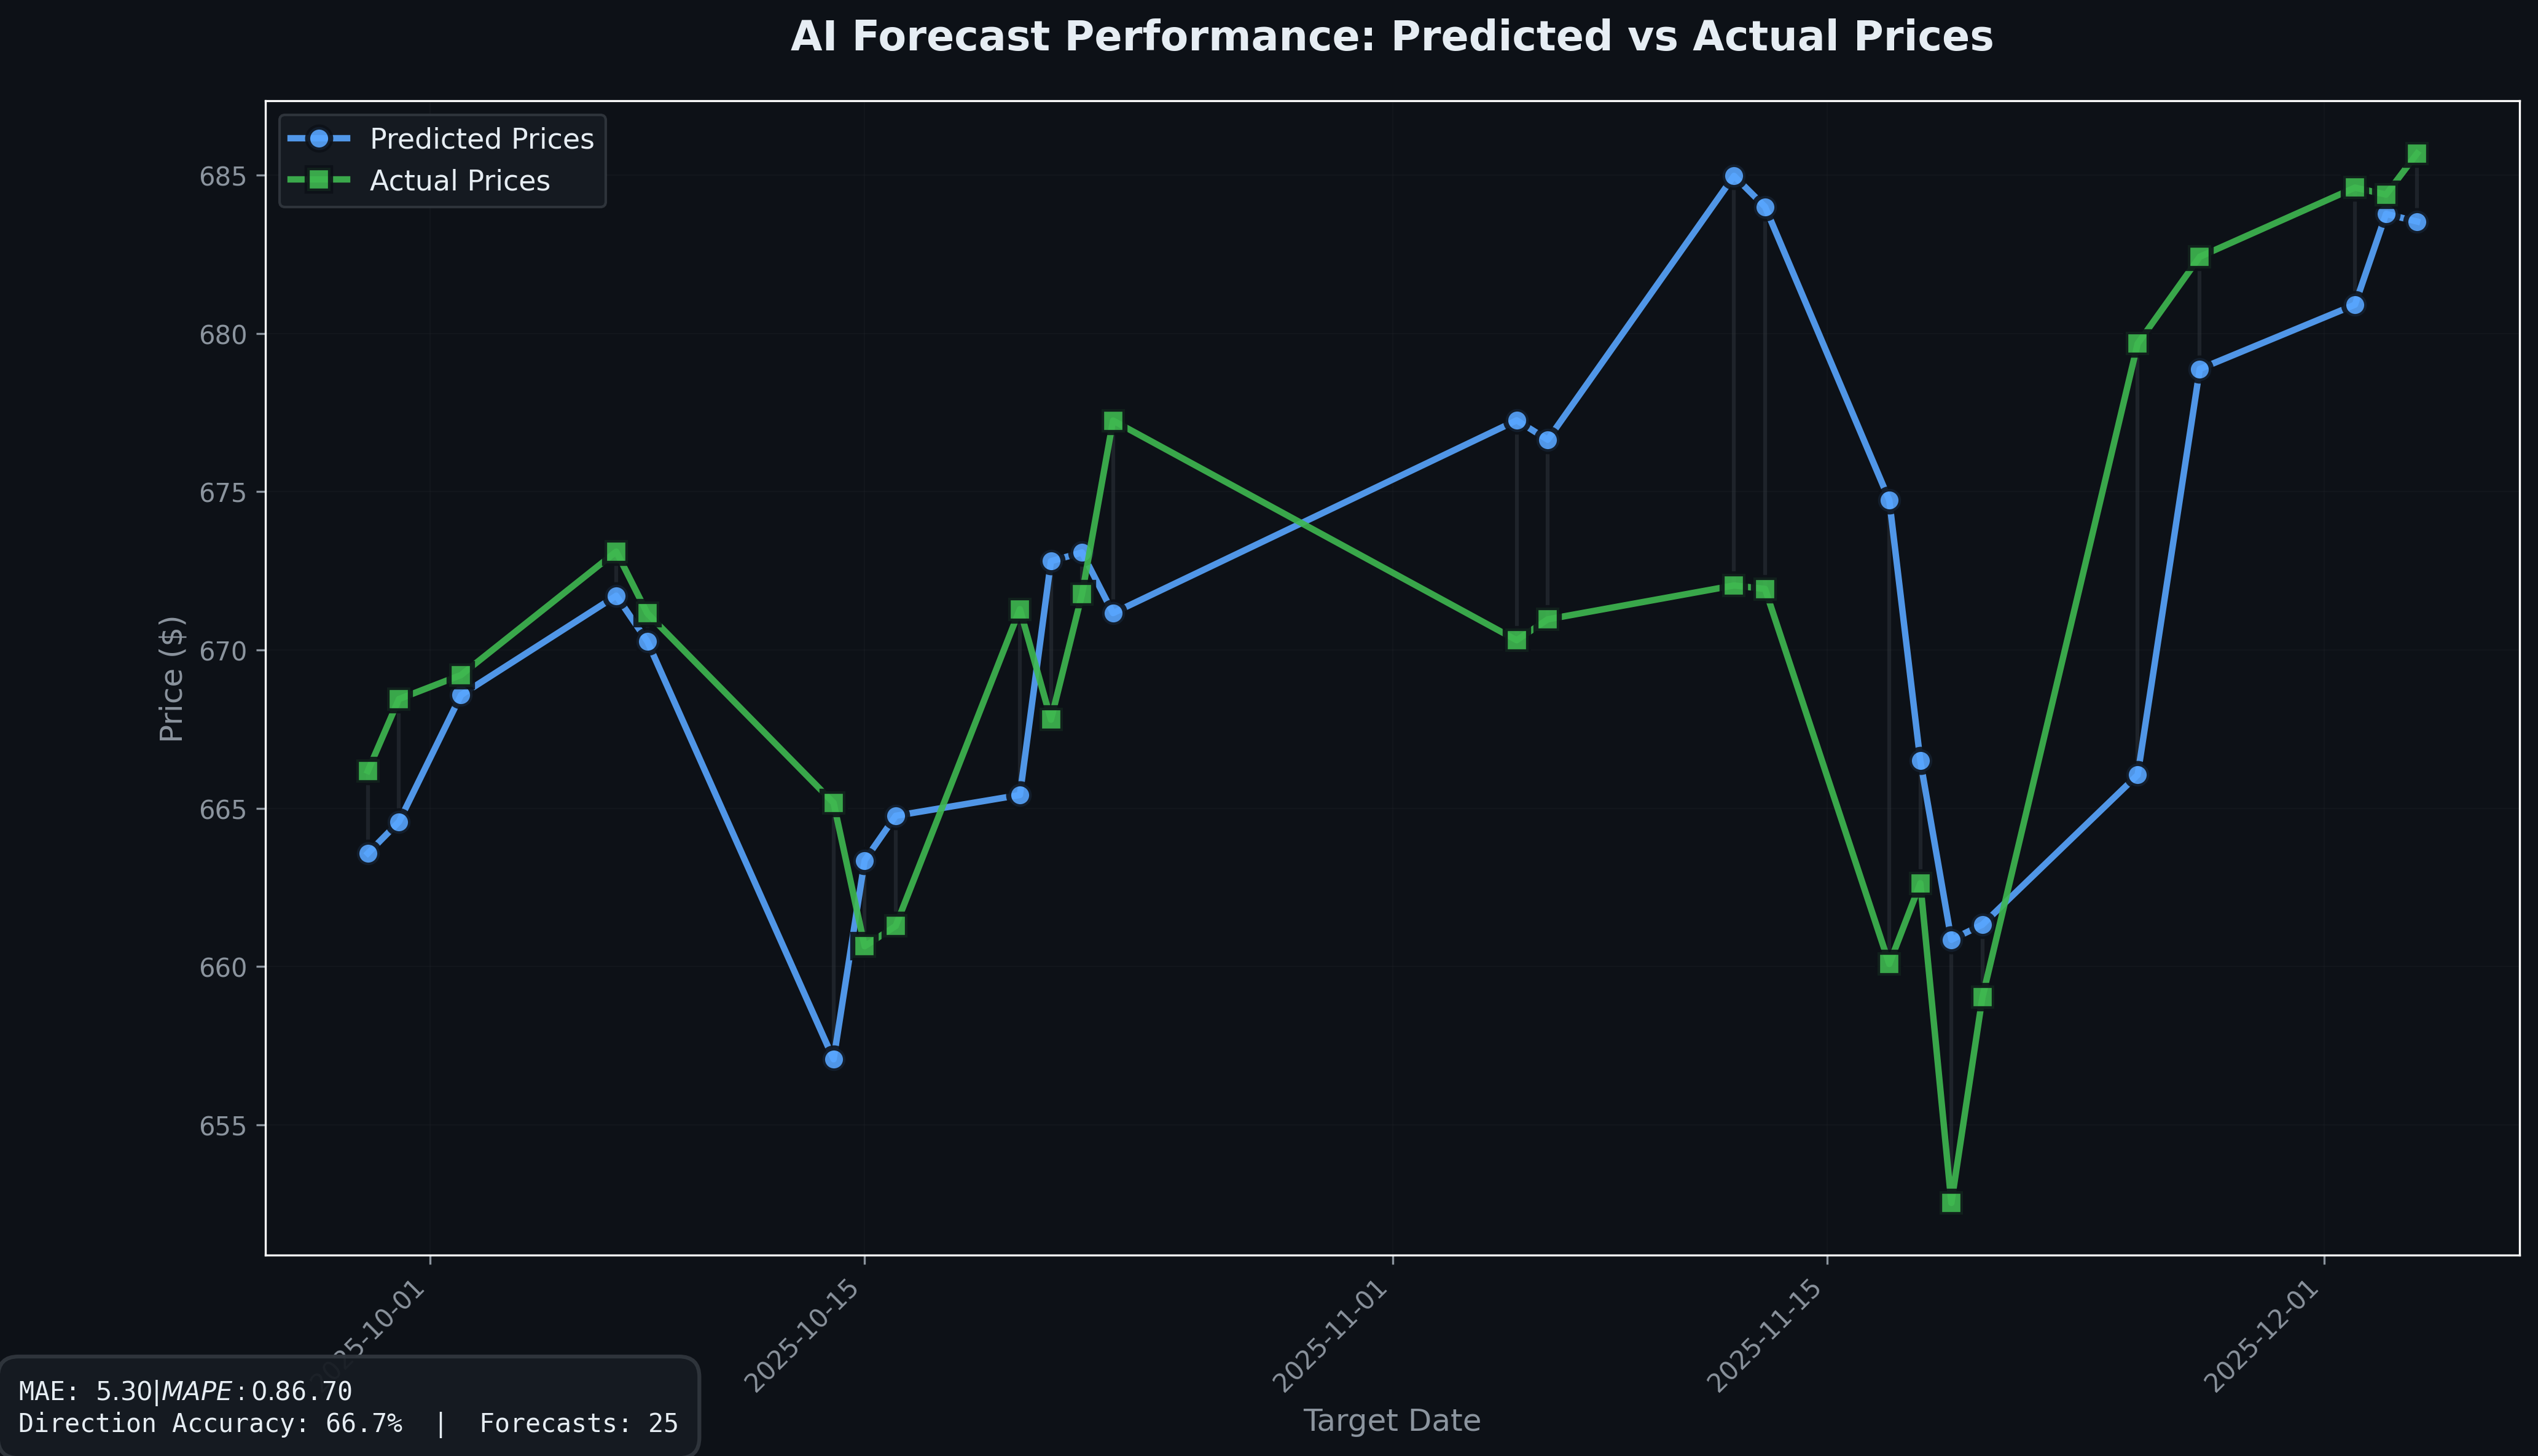
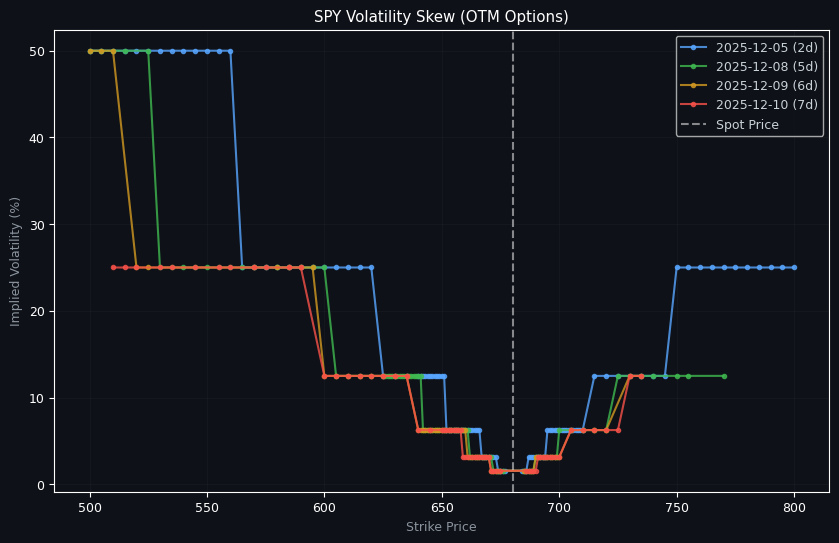
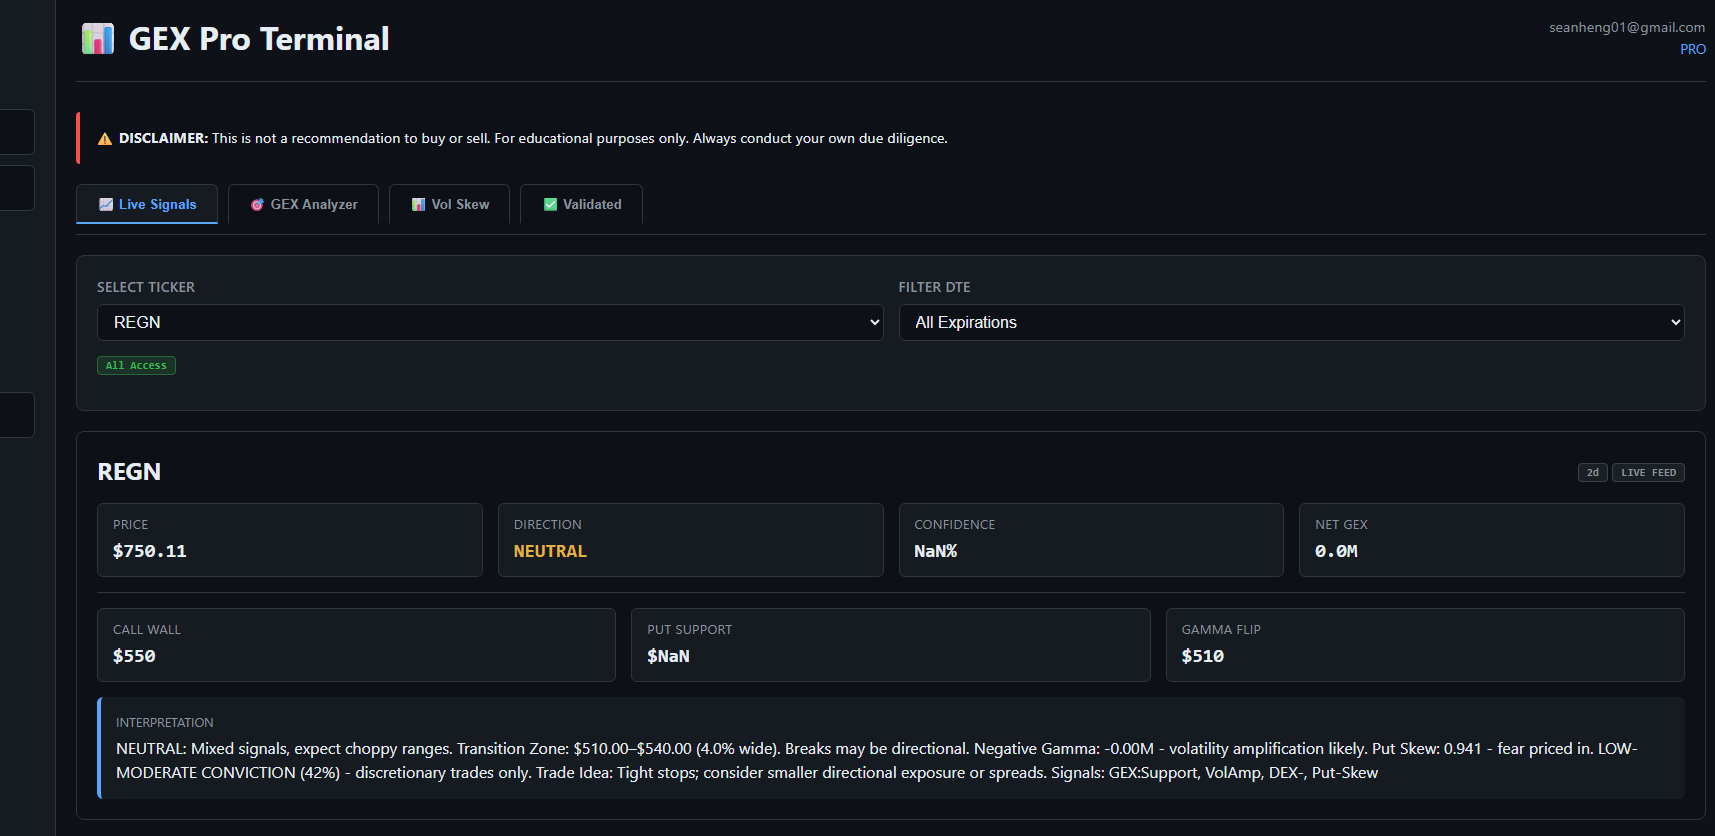
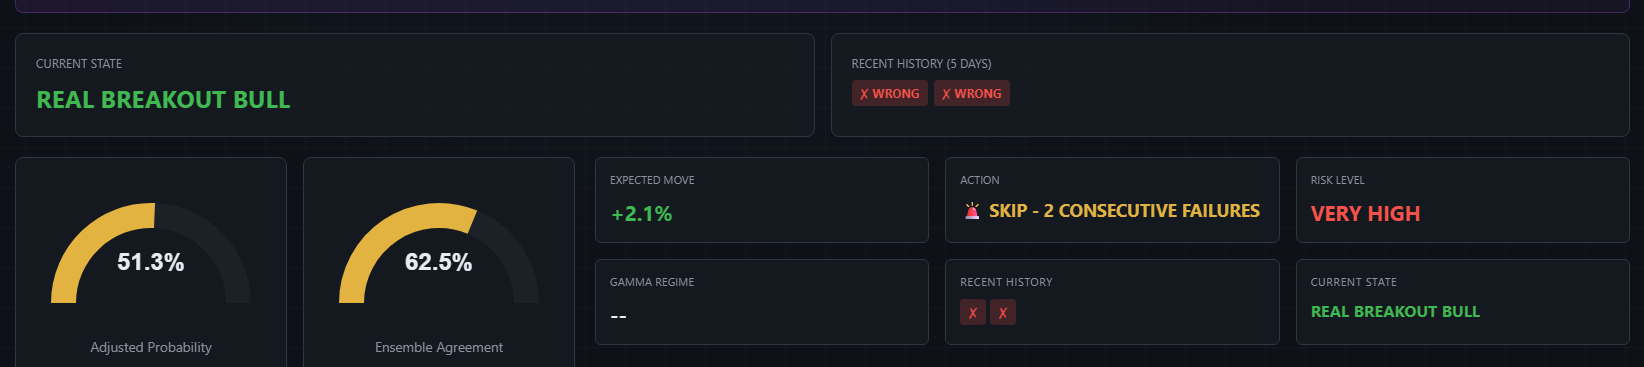
Stop guessing. Start measuring. Access real-time Gamma Exposure (GEX), Volatility Skew, and validated institutional order flow directly from your browser. AI SPY forecasts: 1% MAPE (1-2d), 1.5% MAPE (3-5d).
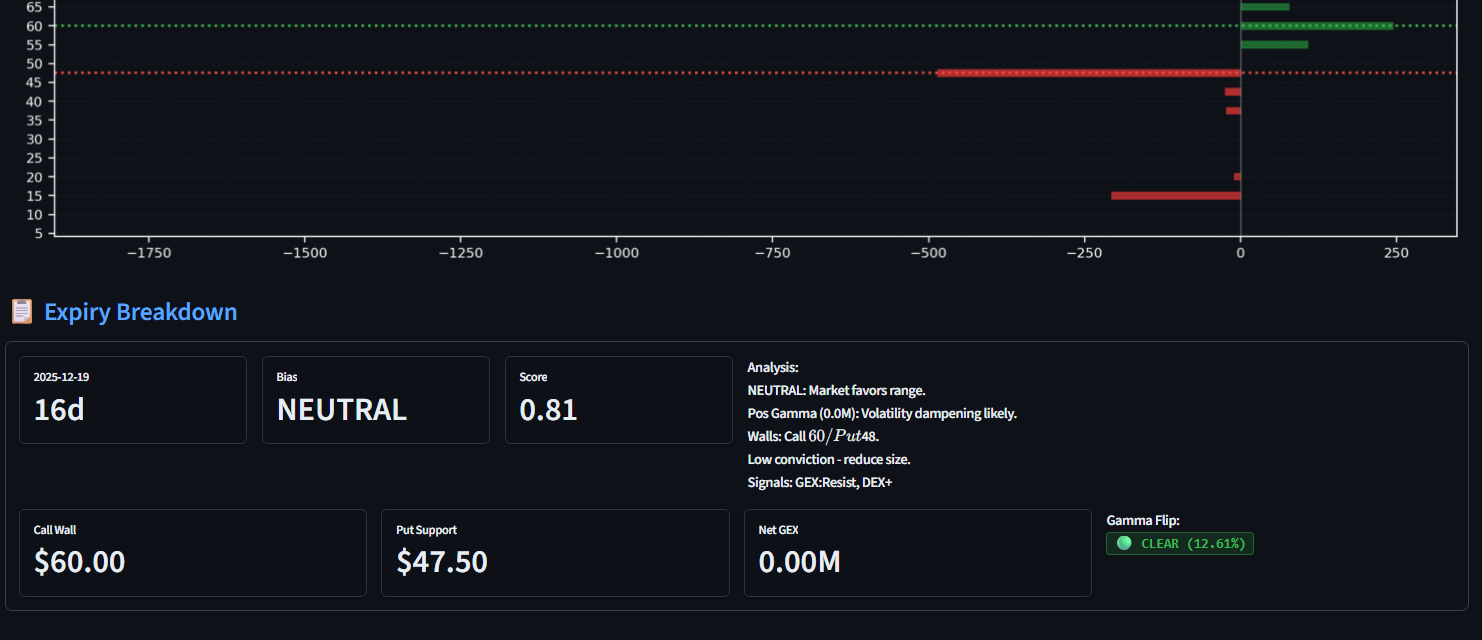
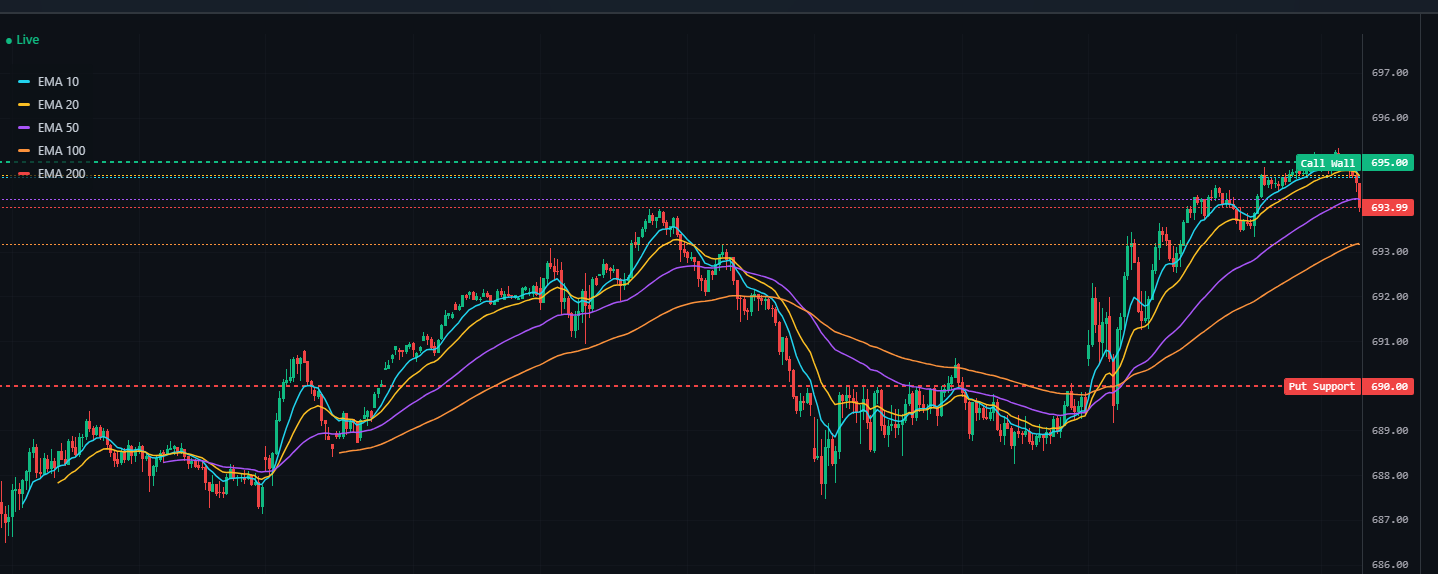
✓ Real-time GEX
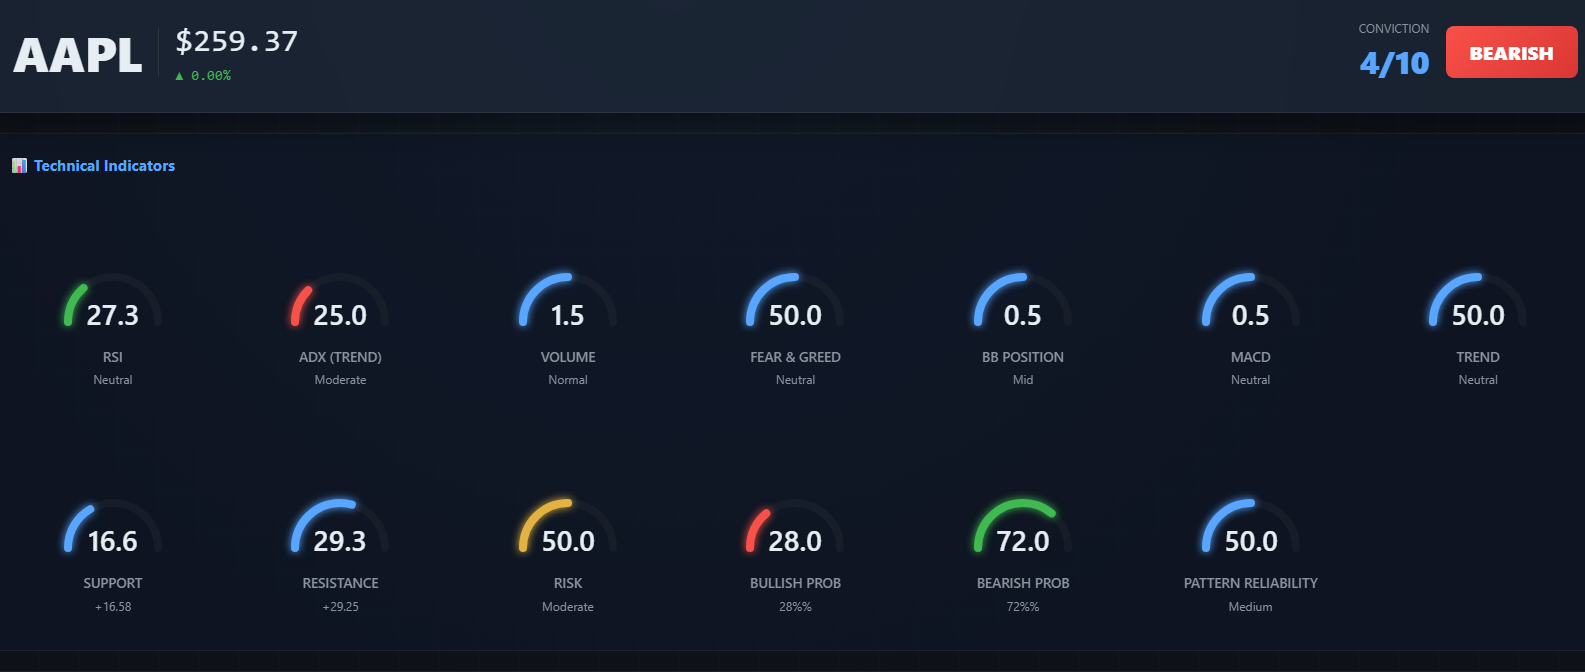
✓ Dealer Positioning
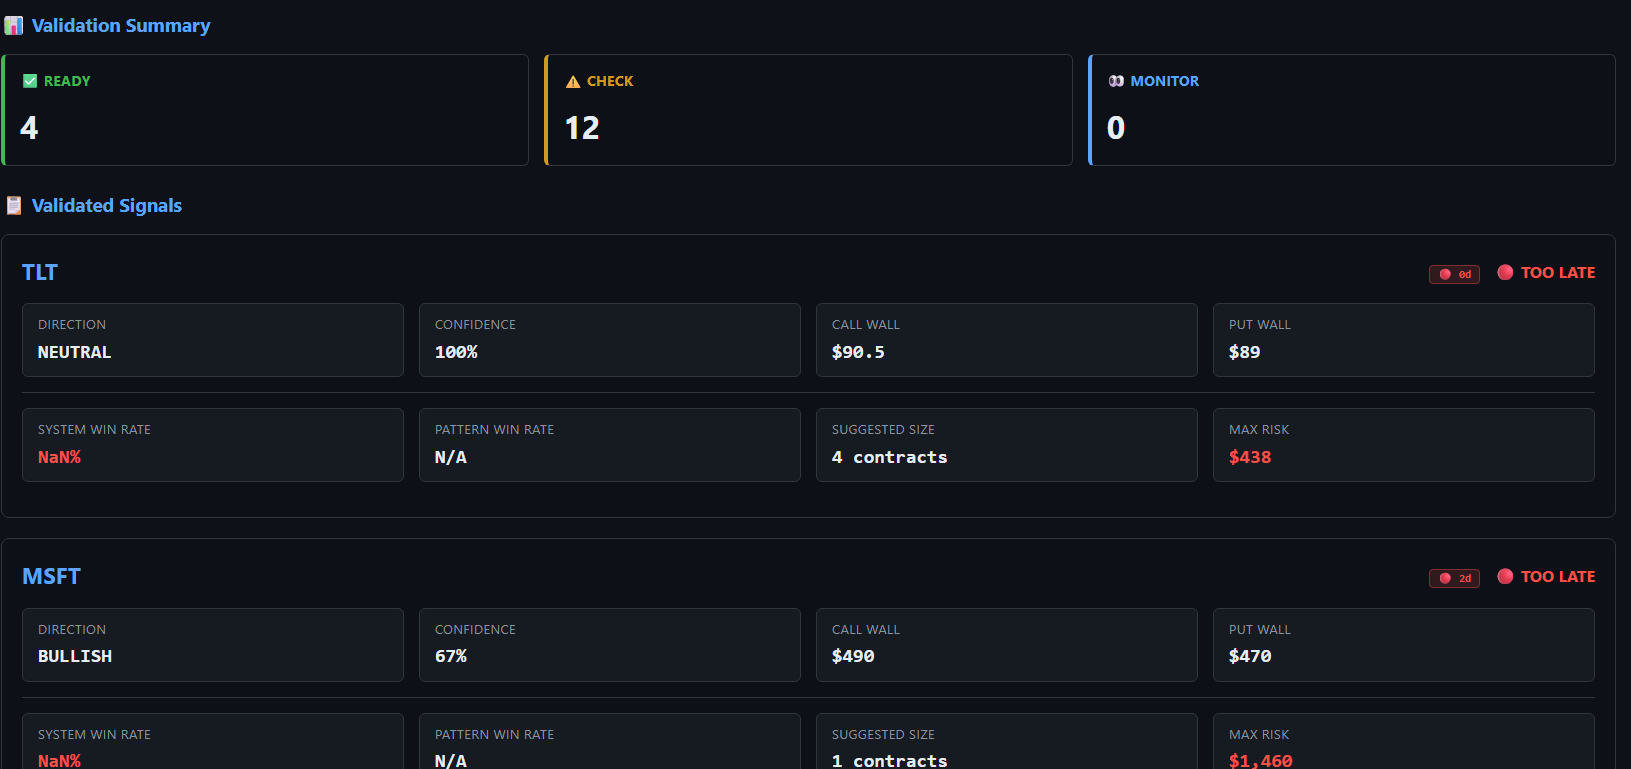
✓ Validated Signals
Visit GEXPro channel for daily market view
📚 Watch Tutorial: Getting Started with GEX Pro
Android App
iOS App
User Login
OR
New account? Just enter your email to start Free Tier. Contact us to get a 14-day Pro free trial.
Need help? Contact us: